


| Sample Sites |
| Back Pond |
| Hancock Pond |
| Keoka Lake |
| Keyes Pond |
| Long Lake (Main basin) |
| Long Lake (South basin) |
| McWain Pond |
| Middle Pond |
| Moose Pond (Main basin) |
| Moose Pond (North basin) |
| Moose Pond (South basin) |
| Peabody Pond |
| Sand Pond |
| Trickey Pond |
| Woods Pond |
Algae either directly or indirectly support much of the life existing in a lake and are considered the foundation of aquatic food webs. Of course, algae are also the source of algal blooms, which usually result from an over-abundance of nutrients and can cause a host of problems within a lake system. Algae, along with cyanobacteria and all other plants, use a pigment called chlorophyll-a (chlorophyll for short) to produce their own food through a process called photosynthesis. Generally, larger algae populations will result in more chlorophyll in the environment.
Chlorophyll is a fluorescent compound. This means that, when exposed to certain wavelengths of light, it will respond by emitting light at a different wavelength. LEA uses a fluorometer to measure, indirectly, the amount of chlorophyll in the water column. The fluorometer is works by emitting blue light at a specific wavelength, which causes chlorophyll molecules to enter a high-energy (“excited”) state. When the molecules return to their normal state, they give off light (fluoresce) at a different wavelength. The fluorometer measures the strength of this return fluorescence. The stronger the fluorescence, the more chlorophyll is present.
The fluorometer reports result in Relative Fluorescence Units (RFUs). This measurement result is not a direct comparison to data obtained through the chlorophyll sampling done on each lake during regular water testing. The fluorometer provides qualitative data, rather than quantitative. Although LEA continues to measure chlorophyll-a concentrations in water as a proxy for algae abundance (reported in chapter 1), lab-based chlorophyll-a measurements are not comparable to chlorophyll concentrations obtained via the fluorometer. Chlorophyll concentrations measured by the fluorometer are to be considered approximate; the instrument provides only a relative chlorophyll concentration, which is not as accurate as lab-based testing but is very useful for viewing trends within a lake.
Monthly fluorometer profiles were collected from the lakes and ponds listed on the right from May through September. Each summary contains a graph of the lake’s results. Many lakes contain a chlorophyll maximum near the thermocline. There are a few reasons why this tends to happen. One, is that there is a large density difference between warm upper-layer water and cold bottom-layer water, so algae that sink down from the upper layer tend to be slowed down at the thermocline and accumulate. Another reason is that some algae prefer the area near the thermocline. While the thermocline is a common place to see algae, algae can, and do, grow deeper in the water column where there are often more nutrients.
Graphs have been included for each test site to visually compare fluorometer, temperature, and oxygen profiles from May through September. The vertical axis (y-axis) indicates depth below the surface, while the horizontal axis (x-axis) represents reported values. Three different parameters are being reported on the same graph, which results in the value units for the horizontal axis varying, based on parameter. Units are noted in parentheses in the legend.
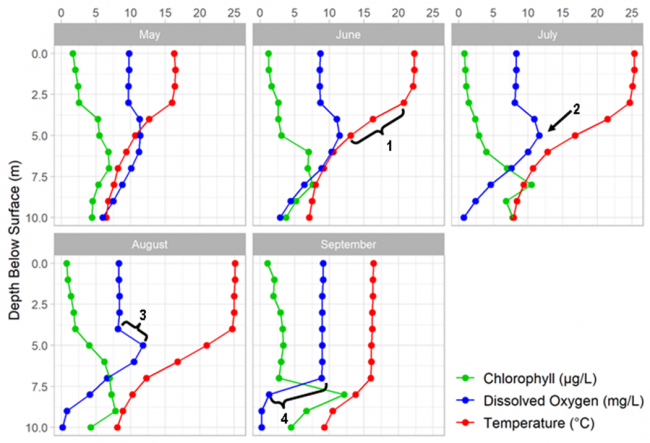
Each graphic contains five graphs, one for every month in LEA’s water monitoring season. Each graph contains a green line, representing chlorophyll concentration, a blue line, representing dissolved oxygen concentration, and a red line, representing temperature. The shape of each line changes from month to month as each parameter changes.
1 = Rapid decrease in temperature
2 = Fluorescence increase
3 = Oxygen increase
4 = Oxygen decrease
