Both LEA buoys were deployed on May 15. Static graphs of data updated hourly are available through the links below.
A report on the 2025 buoy data is available here.
Select buoy location to view data:
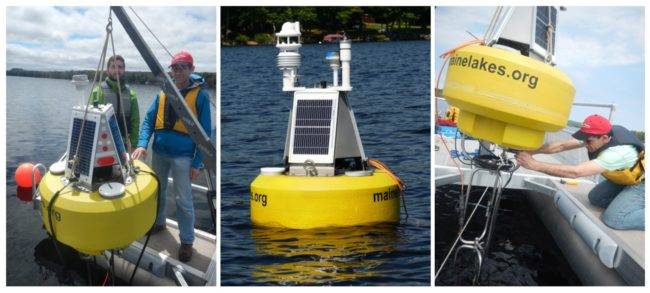
What are they?
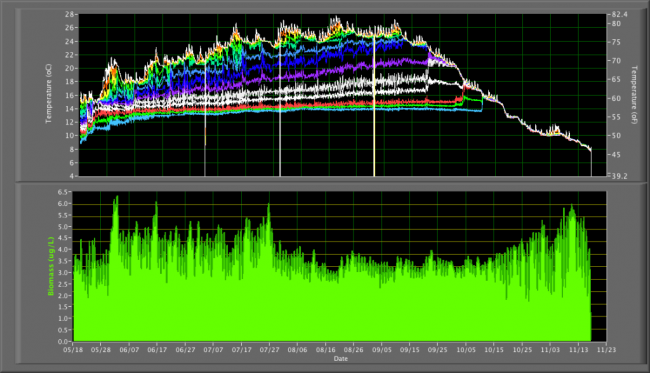
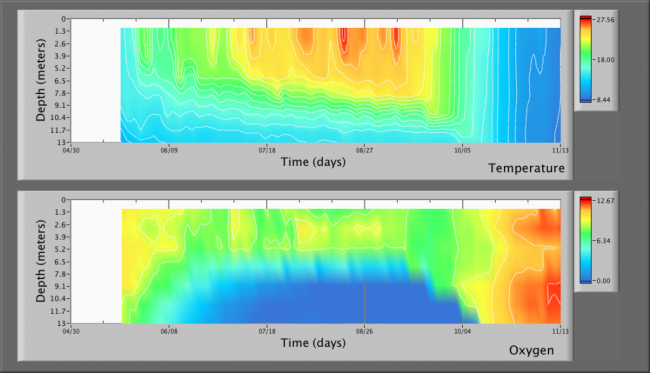
These two automated testing buoys are part of a suite of advanced monitoring initiatives undertaken by LEA to better understand lakes and the factors that affect water quality in real time. Following ice-out in the spring, these buoys are deployed on Highland Lake and Long Lake and continuously monitor oxygen and temperature concentrations throughout the water column. They also measure chlorophyll, which indicates how much algae is present in the water and the Highland Buoy has light sensors in and above the water to measure clarity. The data is stored on internal computers and sent back to LEA every 15 minutes through cellular signals. Both buoys are powered by 3, 10-watt solar panels and a rechargeable battery.
What do they do?
This information allows us to map out oxygen and temperature concentrations throughout the growing season which is important in understanding the factors that control algae growth as well as internal lake structure and mixing. Tying the data to weather conditions lets us see the effects of wind, precipitation and storm events in real time – thus allowing for a better understanding and explanation of conditions in the lake.