Over the course of a year, many lakes shift between having a uniform temperature from top to bottom, to being separated into distinct, temperature-dependent layers. The warmer, most shallow layer is the epilimnion, the middle layer, a narrow zone between warm, shallow and cold, deep waters is the thermocline/ metalimnion, and the coldest, deepest layer is the hypolimnion. This layering, also called stratification, occurs because water density is dependent on water temperature. Warm water will not mix with cold water because the density difference between cold water and warm water prevents it. Lakes stratify in both the summer and winter. Stratification breaks down in the spring and fall, allowing for “turnover” — full mixing throughout the water column. Stratification prevents oxygen exchange between upper and bottom layers, which often results in significant differences in oxygen and nutrient concentrations. This is especially true in late summer when the warm, well-oxygenated epilimnion and the cold hypolimnion are cut off from each other by the thermocline.
Water temperature is critical to the biological function of lakes as well as the regulation of chemical processes. Lake temperature and stratification are greatly influenced by the weather. Air temperature, precipitation, and wind speed and direction can all affect water temperature and stratification patterns from year to year. Lake size, depth, and shape also greatly impact stratification timing and strength. The larger the difference in temperature between the top and bottom layers of the lake, the stronger the stratification is.
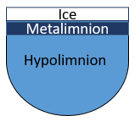

Winter – Ice blocks out sunlight and prevents winds from mixing oxygen into upper waters. With little light below the ice and gradually diminishing oxygen levels, plants stop growing. The water does stratify, with coldest waters near the surface and warmest near the bottom.
Spring – After the ice melts, rising air temperatures warm shallower waters until they are nearly the same temperature as deeper waters. When water temperature is similar from top to bottom, aided by strong winds, shallow and deep waters mix together, redistributing nutrient and oxygen concentrations throughout the water column.
Summer – As air temperature increases, deeper lakes will gradually stratify into a warm upper layer and a cold bottom layer, separated by a thermocline, a zone of rapid temperature and oxygen level change. The upper, warm layers are constantly mixed by winds, which “blend in” oxygen. After stratification, the thermocline prevents colder, deeper waters from mixing with wind-mixed shallower waters and are cut off mixing events that could provide additional oxygen. This can result in deep water oxygen depletion, which may negatively affect cold-water fisheries. When oxygen levels are low at the bottom of the lake, a chemical reaction occurs that releases stored phosphorus from sediments. However, due to the density barrier at the thermocline, these nutrients do not move easily into the epilimnion. This often causes a buildup of phosphorus in the deep waters.
Fall – As air and wind temperatures decrease, shallower waters cool until they are nearly the same temperature as deeper waters. As in Spring, when water temperature is similar from top to bottom, strong winds cause the lake to turn over, which allows oxygen to be replenished throughout the water column
To understand much of LEA’s water quality data, it is helpful to be familiar with some of the properties that make water unique. When water is in its liquid state, its molecules move around freely. As liquid water cools from room temperature to about 4 °C, water molecules slow down and move more closely together. This allows more water molecules to fit in an area resulting in higher water density. As water cools below 4 °C water molecules lock into a rigid position creating open spaces between molecules, the result is when water freezes, it expands and becomes less dense than liquid water. Water’s ability to change density with temperature plays a critical role in the natural processes and ecosystems that LEA monitors.
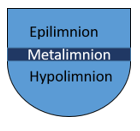
Over the course of a year, many lakes shift between having a uniform temperature from top to bottom, to being separated into distinct, temperature-dependent layers. This layering, also called stratification, occurs because water density changes with water temperature. The warmer, shallowest layer is called the epilimnion and is the least dense layer. The middle layer, is the thermocline/ metalimnion and is where water density and temperature changes rapidly. The coldest, deepest layer is the hypolimnion and is the densest layer. The exact depths of each layer change over the course of the summer and from lake to lake and year to year.
In a lake, warm shallow water will not mix with cold deep water because the density difference between the two layers is so different that they cannot mix. Stratification prevents oxygen exchange between upper and bottom layers, which often results in significant differences in oxygen and nutrient concentrations. This is especially true in late summer when the warm, well-oxygenated epilimnion and the cold hypolimnion are cut off from each other by the metalimnion.
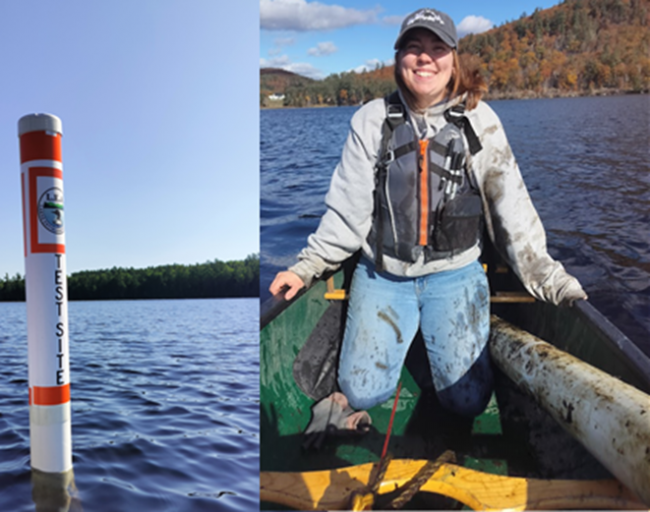
LEA began using in-lake temperature sensors to acquire high-resolution temperature measurements in 2013. The sensors, which are also interchangeably referred to as HOBO sensors, are used to provide a detailed record of temperature fluctuations within lakes and ponds in our service area. High-resolution temperature data allows for a better understanding of a water body’s thermal structure, water quality, and the possible influence of climate change.
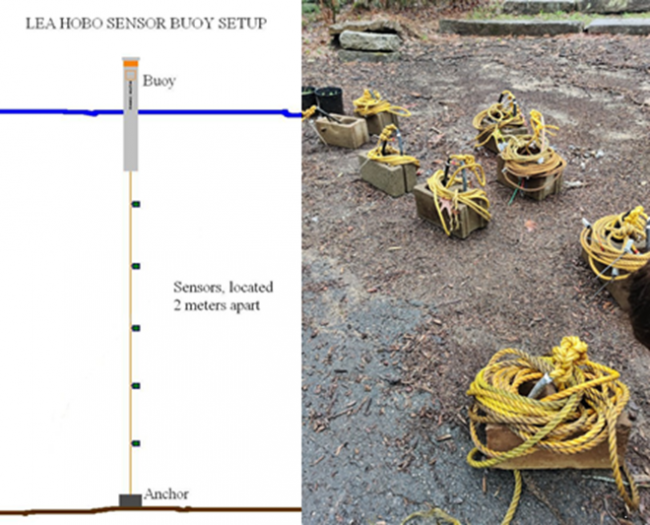
Each year, we attempt to capture the entire stratified period within the temperature record, from when stratification begins to form in the spring to when the lake mixes in the fall. With funding and support from local lake associations, LEA has deployed temperature sensors at seventeen sites on thirteen lakes and ponds. Sensors are attached to a floating line held in place by a regulatory-style buoy and an anchor. The sensors are attached at 2- meter intervals, beginning one meter from the bottom and ending approximately one meter from the top. Each buoy apparatus is deployed at the deepest point of the basin it monitors. The setup results in the sensors being located at odd numbered depths throughout the water column (the shallowest sensor is approximately 1 meter deep, the next is 3 meters, etc.).
Temperature sensors are programmed to record temperature readings every 15 minutes. LEA has for many years used a handheld YSI meter to collect water temperature data however this method is time consuming, resulting in only eight temperature profiles per year. While temperature sensors require an initial time investment, once deployed, the sensors record over 15,000 profiles before they are removed in the fall. This wealth of data provides much greater detail and clarity than the traditional method ever could. Daily temperature fluctuations, brief mixing events caused by storms, the date and time of stratification set up and breakdown, and the timing of seasonal high temperatures are all valuable and informative events that traditional sampling can’t accurately measure.
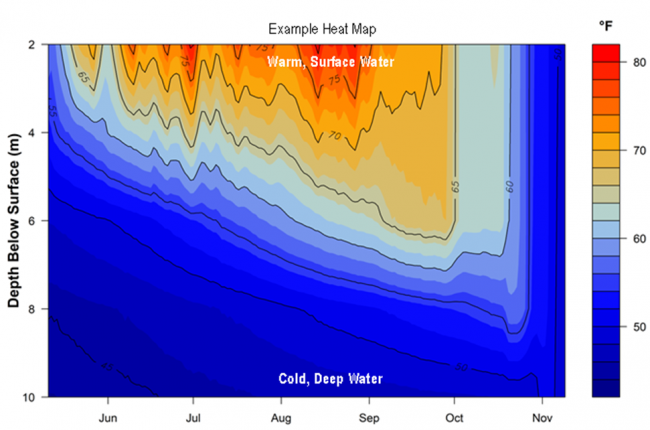
Temperature monitoring summaries on the following pages include a temperature map for each lake, displaying all the data collected in the 2023 season. Temperature maps were generated using daily mean temperature values, which help determine temperature across depth and time. Temperature is represented by colored contours, where the red to blue color range corresponds to a high to low temperature range. The vertical bar on the right side of the temperature map indicates the temperature each color represents in degrees Fahrenheit (°F). The horizontal axis shows the months sensors were deployed, while the left-hand vertical axis shows sensor depth (meters) below the water’s surface.
Temperature stratification shows up as areas of the plot where colors change in the vertical direction and contour lines are tilted more towards horizontal (from June through early November). The area where temperature changes most rapidly with depth is often referred to as the thermocline. Vertical contour lines indicate mixed conditions, and areas of a single color from top to bottom (such as late-October into November) indicate completely mixed conditions. Warm, stratified conditions stand out as darker red areas. Large gaps between lines means there is a large temperature difference between depths.
During stratification, the shallower waters do not easily mix with the deeper waters. It is only when the temperature of the upper water cools down that the lake can fully mix. You can see this process happening on each graph: the temperatures near the surface get cooler and the deeper waters get warmer as the barrier between the two layers weakens and the waters begin to mix. The lines converge one by one until the temperature is the same at each depth. This is known as lake turnover or de-stratification.