


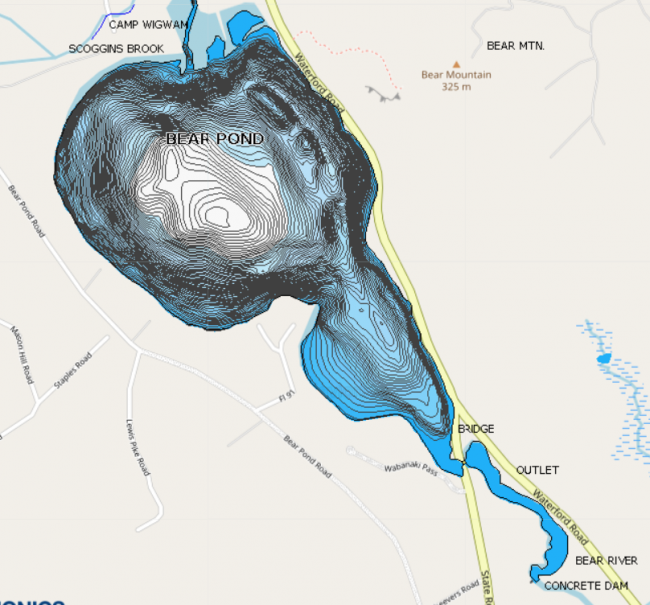
A steeply sloped, paved boat access is located on Route 35 along the eastern shoreline. The road shoulder is widened to provide some limited parking.
Bear Pond is Waterford’s deepest lake. It is said to be named after a bear that was killed in its waters during the early settlement of Waterford. LEA first collected water monitoring data from Bear Pond in 1978. Today, it is monitored biweekly during the open water season. In recent years, LEA staff have made trips out onto Bear Pond during the winter water monitoring season.
Click on a program below for the most recent data summary. For descriptions of each program, return to our Lake Look-Up page.
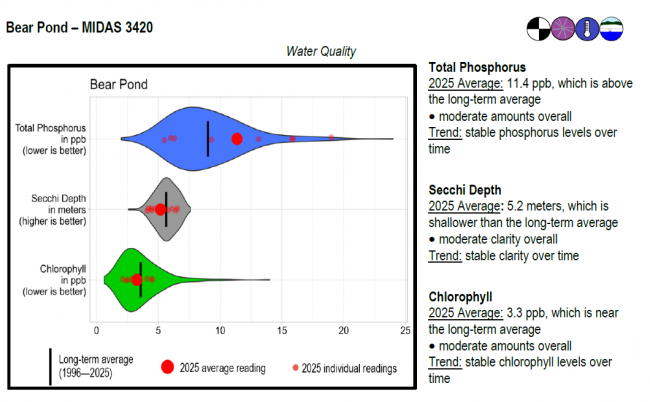
Bear Pond surface water chlorophyll (ppb), phosphorus (ppb), and Secchi depth (meters) data comparison. Colored areas represent the long-term range of values, from minimum to maximum. Area thickness indicates frequency of measurements at that value. Area thickness increases as more measurements are reported at that value. The vertical black line represents the long-term average value. The large red dot represents 2025’s average value. The small red dots represent individual readings taken in 2025.
Water Quality overview and methods
2025 as a Year (overall summary)
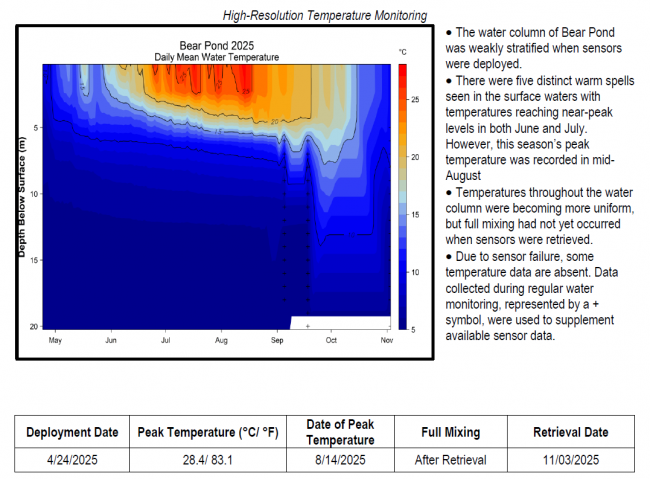
Temperature maps were generated using daily mean temperature values, which help determine temperature across depth and time. Temperature is represented by colored contours, where the red to blue color range corresponds to a high to low temperature range. The vertical bar on the right side of the temperature map indicates the temperature each color represents in degrees Fahrenheit (°F). The horizontal axis shows the months sensors were deployed, while the left-hand vertical axis shows sensor depth (meters) below the water’s surface.
Temperature stratification shows up as areas of the plot where colors change in the vertical direction and contour lines are tilted more towards horizontal (from June through early November). The area where temperature changes most rapidly with depth is often referred to as the thermocline. Vertical contour lines indicate mixed conditions, and areas of a single color from top to bottom (such as late-October into November) indicate completely mixed conditions. Warm, stratified conditions stand out as darker red areas. Large gaps between lines means there is a large temperature difference between depths.
High Resolution Temperature Monitoring Methods and Reading Graphs
 Algae Monitoring Summary
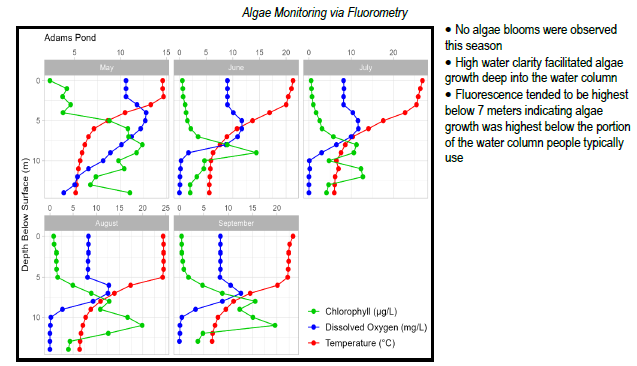
Graphs have been included for each test site to visually compare fluorometer, temperature, and oxygen profiles from May through September. The vertical axis (y-axis) indicates depth below the surface, while the horizontal axis (x-axis) represents reported values. Three different parameters are being reported on the same graph, which results in the value units for the horizontal axis varying, based on parameter. Units are noted in parentheses in the legend.
LEA also has an active Courtesy Boat Inspection Program on Bear Pond and offers Technical Assistance to landowners through Clean Lake Check Ups.
Bear Pond is regularly stocked by the Maine Department of Inland Fisheries and Wildlife with landlocked salmon and brook trout. These two fish have also been known to spawn in Mutiny Brook. The pond also has populations of lake trout, splake, rainbow smelt, smallmouth bass, largemouth bass, white perch, yellow perch, chain pickerel, hornpout, pumpkinseed sunfish, slimy sculpin, American eel, white sucker and golden shiner and fallfish minnows.
General fishing laws apply, except: From October 1 – December 31: ALO (Artificial lures only), S-7 (All trout, landlocked salmon, and togue caught must be released alive at once).
In the spring of 2013, 22 volunteers and staff from five organizations walked and drove the Bear Pond Watershed looking for erosion sites that were impacting water quality. Undersized culverts, steep roadside banks, washed-out road shoulders and poorly constructed driveways were some of the culprits the team identified. While erosion anywhere within the watershed (the land that drains to Bear Pond) can impact individual wetlands and landowners, the crew was specifically looking for places where soil was washing into the pond or into streams that can carry sediment quickly to the pond. Typically, the areas where we see the most problems are roads, driveways and intensely used residential property along the water. To see all the findings, download the Bear Pond Survey.
Return to LEA’s Lake Look-Up page to search for a different lake, or type it in below.
