For decades, Lakes Environmental Association (LEA) has watched over the water quality of 41 lakes in our service area, by collecting and analyzing water samples during late spring through early fall. Water testing in LEA’s service area occurs every year through traditional and advanced testing initiatives. For each lake visited, we travel by boat to the deep spot to collect: a clarity measure, a Gloeotrichia echinulata density estimate, weather observations, a temperature profile, an oxygen profile, a chlorophyll-a sample, a total phosphorus sample, and a water chemistry sample. Temperature, oxygen, clarity, Gloeo, and weather data are recorded on field sheets. A water sample of the epilimnion, the warm upper waters, is collected and brought back to the Maine Lake Science Center for chlorophyll, total phosphorus, and water chemistry analysis. This data contribute to our long-term understanding of lake/pond behavior and health.
The size of our service area and the quantity of analysis performed produce a large amount of data. Our data are available to the public through Maine’s Department of Environmental Protection and by contacting LEA. Chlorophyll-a concentration, total phosphorus concentration, and water clarity, when considered together, help us to describe water quality conditions in a waterbody and allow us to monitor how water quality conditions may be changing over time.
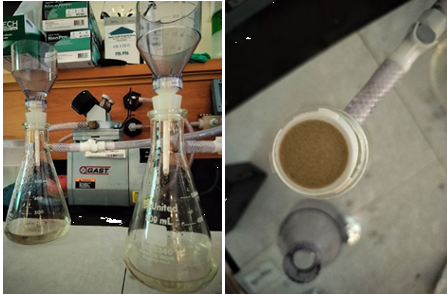
Left: LEA’s chlorophyll filtering apparatus. Filters are placed on a small pedestal held in place by a funnel. Water is pulled through a filter.
Right: When all water has been pulled through, the filter holds whatever algae was suspended in the water sample. The filter is used to determine how much chlorophyll was in the filtered water.
Epilimnion is the shallowest layer in a stratified lake. This layer is sunlit, wind mixed, and oxygen rich.
Metalimnion is the middle layer in a stratified lake. This layer acts as a thermal barrier that prevents the interchange of nutrients between the warm upper waters and the cold bottom waters.
Hypolimnion is the deepest layer in a stratified lake. This layer is contains the cold water at the bottom of lakes. Food for most creatures in in short supply and the reduced temperatures and light penetration prevent plants from growing.
Clarity is a measure of water transparency. Clarity is measured in situ by lowering a Secchi disk into the water until it can no longer be seen. Higher Secchi values indicate clearer water. Clarity is reported in meters.
Temperature is measured in situ by lowering a probe into the water. The probe is allowed to adjust to temperature conditions at one-meter interval from the surface to the bottom of the lake. Temperature data are recorded and used to assess thermal stratification. Temperature is reported in degrees Celsius.
Dissolved oxygen is measured in situ at one-meter intervals from the surface to the bottom of the lake. It is measured in parts per million (ppm).
Chlorophyll-ais a pigment found in all plants, including algae. Chlorophyll (the –a is dropped for simplicity) is used to estimate the amount of algae present in the water column. Samples are collected from the top layer (epilimnion) of a lake and brought to MLSC for analysis. Chlorophyll concentrations are measured in parts per billion (ppb).
Epilimnetic Total Phosphorus is a nutrient needed by algae to grow. It is measured in order to determine the potential for algae growth in a lake. Phosphorus samples are collected from the lake’s upper layer (epilimnion) and are brought to MLSC for analysis. Epilimnetic total phosphorus samples tell us how much phosphorus is available for algae in the sunlit portion of a lake, where the algae grow. Phosphorus is measured in parts per billion (ppb).
Deep Water Total Phosphorus samples are collected at specific depths below the thermocline in late August. Deep water samples showing high phosphorus (10 ppb or higher than upper layer phosphorus samples), indicate that sediments may be releasing phosphorus and that the lake is potentially susceptible to future algal blooms.
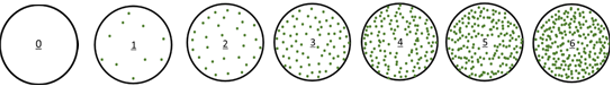
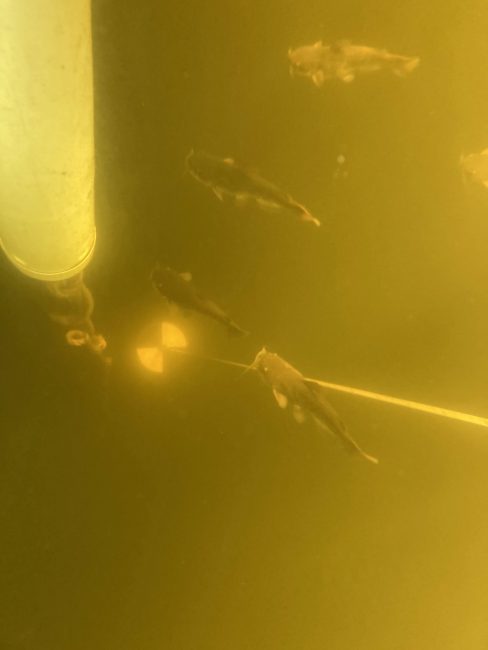
Gloeotrichia echinulata density is a visual estimate of the number of individual Gloeotrichia echinulata (Gloeo) colonies floating in surface waters. Gloeo is a type of cyanobacteria (blue-green algae) commonly found in low-nutrient waters. Gloeo density is reported as a value ranging from 0 – 6, based on the number of Gloeo colonies seen through a Secchi scope. Higher values indicate more Gloeo colonies.
LEA visits 26 sites, bi-weekly from May through September. We visit an additional 19 sites, in late August. For each lake visited, we travel by boat to the deep spot to collect: a clarity measure, a Gloeotrichia echinulata density estimate, weather observations, a temperature profile, an oxygen profile, a chlorophyll-a sample, a total phosphorus sample, and a water chemistry sample. Temperature, oxygen, clarity, Gloeo, and weather data are recorded on field sheets. A water sample of the epilimnion, the warm upper waters, is collected and brought back to the Maine Lake Science Center for chlorophyll, total phosphorus, and water chemistry analysis.
Before testing begins, we first need to get out on the water. For most of the sampling season, LEA relies on lakefront landowners for access to the water and boats. These gracious property owners allow us to make the most of our time, reduce travel costs and help ensure that we are not moving aquatic species from one waterbody to another.
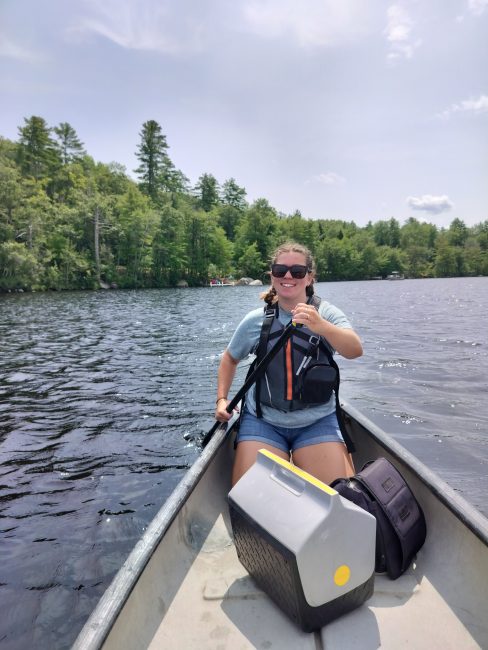
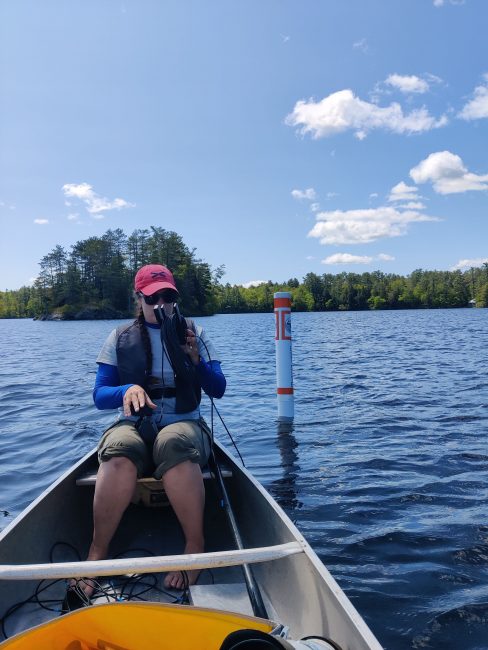
Once on the water, we begin by paddling or boating out to the deepest part of the lake. This is where a full profile of the water column can be attained and the influence of day-to-day weather fluctuations is diminished. After lining up with known references on the shore or going to a GPS-marked waypoint, several depth readings are taken using a handheld sonar depth finder. Once adequate depth is found, the next step is to anchor, which prevents the boat from drifting in the wind or moving with the current. After documenting weather conditions, date, and time of day, a water clarity reading is taken using a Secchi disk. This is an eight-inch round disk divided into quarters that alternate between black and white.
This disk is slowly lowered into the water on a metered tape while a monitor watches it closely through a view scope which cuts out overhead glare. When the disk completely disappears, the tape is pinched at the waterline to get a reading. Clear lakes give deep readings while turbid, tea-colored or highly productive lakes give shallow readings.
Next, a temperature and oxygen profile is taken. This is done with a hand-held electronic meter. Readings are recorded every meter from the surface to the bottom of the lake. The temperature profile shows the lake stratification and indicates whether there is a suitable habitat for coldwater fish. An oxygen profile can show what state the lake is in, how much biological activity is occurring, and whether or not the lake is at risk for internal phosphorus recycling.
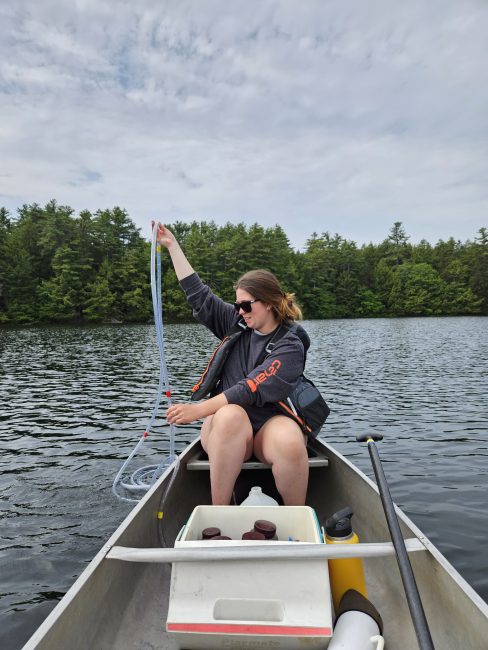
From the temperature and oxygen profile, the depth of the core sample is determined. The core sample is simply a composite sample of the upper, sunlit water where photosynthesis is occurring. The “core” is taken with flexible tubing that is lowered slowly into the water column, sealed, and then brought back up. From this composite sample, individual water samples are taken for phosphorus (the nutrient that controls algae growth), chlorophyll-a (the green pigment found in plants), pH, alkalinity, conductivity, and color.
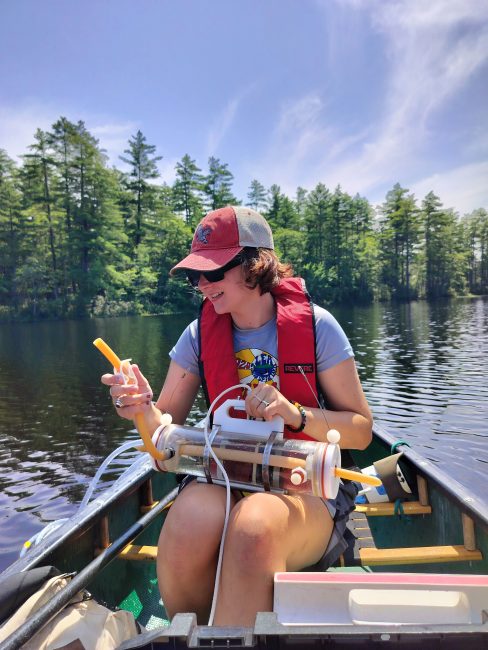
During the month of August, individual grab samples are also taken at discrete depths. This is done with a Van Dorn-style sampler that can be closed at specific depths by using a weighted messenger. These grab samples are taken to determine whether phosphorus is being recycled into the upper waters from the sediments.
Water quality reports for each lake are available in LEA’s water testing report or on each lake’s individual lake page.
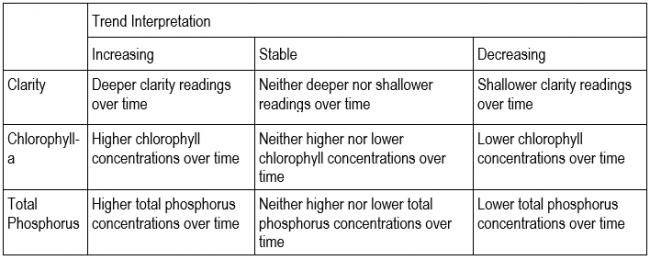
Long-term Trend Analysis for Clarity, Chlorophyll-a and Total Phosphorus
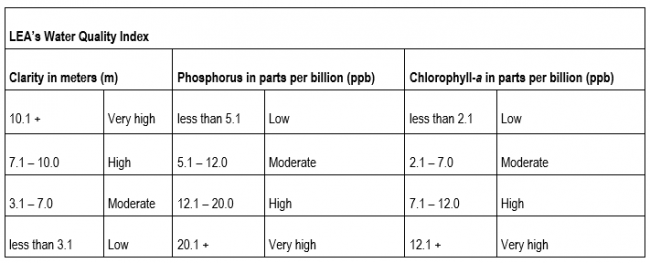
Available data was analyzed to determine if clarity, chlorophyll-a, and total phosphorus data are changing over time. Both chlorophyll-a and total phosphorus are measured in parts per billion (ppb). Clarity is measured in meters (m). Data trends help us estimate the relationship between a water quality parameter and time. For example, to determine the clarity trend on any given lake, all of the clarity readings we have collected for that lake since 1996 are plotted on a graph with time on the horizontal axis and Secchi depth on the vertical axis. A trend analysis draws a ‘best fit’ line through the data. If the direction of the line trends up, it is a positive trend, while a flat line indicates no trend, and a downward line indicates a negative trend.
Current Year and Long-Term Water Quality Classification
Clarity, chlorophyll-a, and total phosphorus data from both this year’s monitoring season and our long term dataset were averaged and classified according to LEA’s water quality index, outlined below. The average is a simple mean of all data collected for each parameter this year. The long-term average is a simple mean of all the data we have on record for each reported parameter. The long-term average doesn’t tell us how each parameter changes over time; it is instead used to see how the current year’s data compares to historical values.