LEA visits Bog Pond once a year in late August. In 2024, both chlorophyll concentration and total phosphorus concentration were below their long-term averages. Clarity is not reported this year because the Secchi disk hit bottom before dissapearing, making the clarity reading unreliable. Long-term trend analysis indicates that total phosphorus and chlorophyll-a concentrations are stable. No trend analysis is reported for clarity because the Secchi disk has hit the bottom of Bog Pond every year a reading has been attempted. This year’s surface water temperature was warmer than last year’s surface water temperature. Oxygen depletion was not observed in 2024. Gloeotrichia echenulata colonies were not observed in 2024.
Bog Pond’s surface water chlorophyll (ppb), phosphorus (ppb), and Secchi depth (meters) data comparison. Colored areas represent the long-term range of values, from minimum to maximum. Area thickness indicates frequency of measurements at that value. Area thickness increases as more measurements are reported at that value. The vertical black line represents the long-term average value. The large red dot represents 2024’s average value.

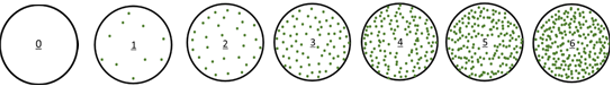
Gloeotrichia echinulata (a type of cyanobacteria (blue-green algae) commonly found in low-nutrient waters) can be seen with the naked eye. Gloeo density is reported as a value ranging from 0 – 6, based on the number of Gloeo colonies seen through a Secchi scope. Higher values indicate more Gloeo colonies. Gloeotrichia echenulata colonies were not observed in Bog Pond in 2024.