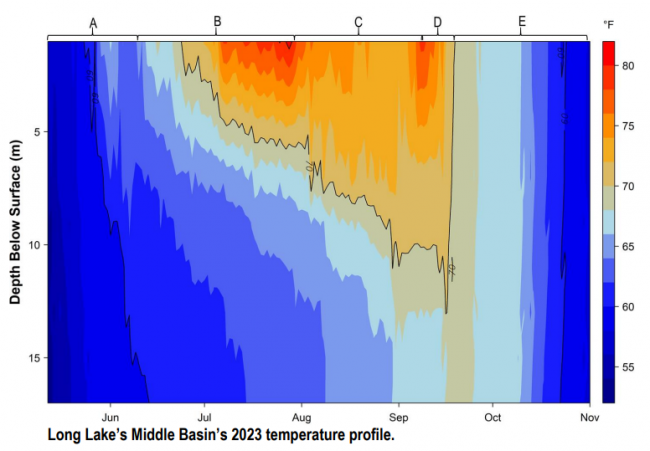
A. The water column of Long Lake’s middle basin was not stratified when sensors were deployed in early mid-May. Shallower waters gradually warmed throughout May before a slight, short cool down in early June. Deep waters warmed slightly as the lake began to stratify.
B. Surface water temperature increased steadily from mid-June throughout July with peak temperature occurring on July 28 (27.7°C/ 81.8 °F).
C. Surface waters began cooling slightly throughout August before reaching near peak temperatures in early September. Deep waters continued to warm but stayed cold enough to maintain stratification.
D. Shallow waters began to cool and mix with waters from the middle depths. Deep waters were still cold but had started to warm slightly. The decrease in temperature difference between shallow and deep waters is a precursor to fall turnover.
E. Temperatures throughout the water column became uniform resulting in lake mixing in mid-September.
