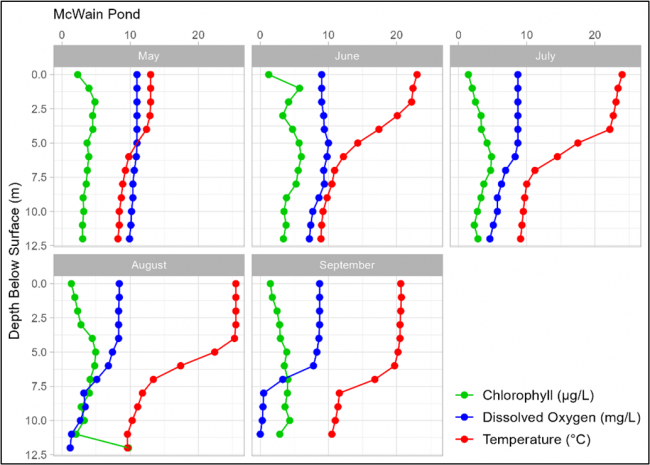
McWain Pond’s monthly fluorescence, oxygen, and temperature profiles. Chlorophyll concentration (green line), dissolved oxygen concentration (blue line), and temperature data (red line) were collected at every meter from the surface to the bottom from May through September.
Throughout the season, algae concentrations tended to be lowest at the surface. Each month saw a fluorescence increase which typically occurred between 1 meter and 6 meters. Elevated readings tended to be near the thermocline meaning that these readings are represented in the chlorophyll samples analyzed in the Water Quality figure above. August’s high reading near the bottom was likely caused by sediment interference
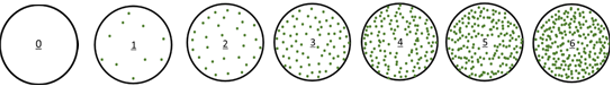
Gloeotrichia echinulata (a type of cyanobacteria (blue-green algae) commonly found in low-nutrient waters) can be seen with the naked eye. Gloeo density is reported as a value ranging from 0 – 6, based on the number of Gloeo colonies seen through a Secchi scope. Higher values indicate more Gloeo colonies. . Low amounts of Gloeotrichia echenulata colonies, less than 1 on the Gloeo density scale, were observed in late August this year.