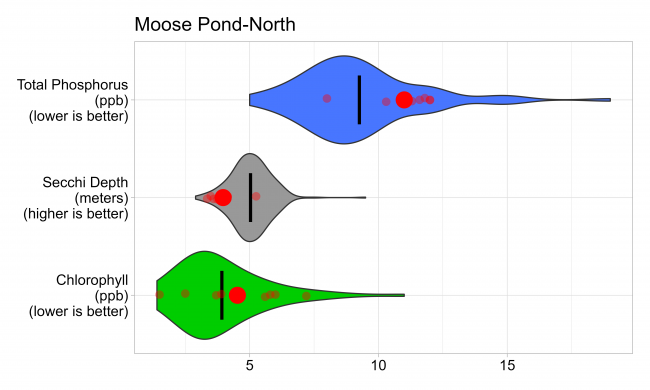
The average Secchi disk reading for 2023 was 6.0 meters, which falls into the moderately clear range. The average total phosphorus reading of 7.5 ppb falls into the moderate range. The average deep water phosphorus value was less than 10 ppb above average surface water phosphorus values, which suggests phosphorus recycling is not problematic. The chlorophyll-a average of 4.9 ppb falls into the moderate range. Long-term trend analysis indicates chlorophyll-a concentrations are stable, total phosphorus concentrations are increasing, and clarity readings are decreasing. This trend analysis is based on our 9-year long dataset and may not accurately represent long-term trends; however, trend analysis will be more precise as our dataset grows. The south basin’s Gloeotrichia echenulata density ranged from 0 through 3 with the highest density occurring in mid-August.

Moose Pond south basin’s surface water chlorophyll (ppb), phosphorus (ppb), and Secchi depth (meters) data comparison. Colored areas represent the long-term range of values, from minimum to maximum. Area thickness indicates frequency of measurements at that value. Area thickness increases as more measurements are reported at that value. The vertical black line represents the long-term average value. The large red dot represents 2023’s average value. The small red dots represent individual readings taken in 2023.

Gloeotrichia echinulata (a type of cyanobacteria (blue-green algae) commonly found in low-nutrient waters) can be seen with the naked eye. Gloeo density is reported as a value ranging from 0 – 6, based on the number of Gloeo colonies seen through a Secchi scope. Higher values indicate more Gloeo colonies. The south basin’s Gloeotrichia echenulata density ranged from 0 through 3 with the highest density occurring in mid-August.
