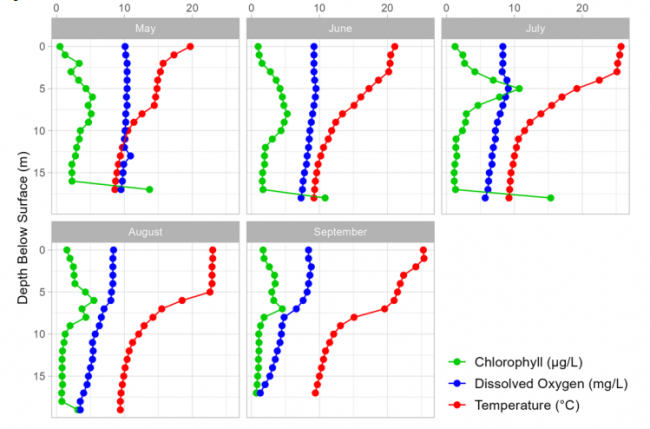
May – The water column of Peabody Pond was already weakly stratified. There was a mild fluorescent peak at 2 meters, then levels went back down before again increasing in concentration between 5 and 9 meters. In the deep waters, algae concentrations went back down to low levels. Increased fluorescence values near the bottom are likely caused by interference from bottom sediments.
June – Fluorescence values gradually increased with depth until reaching a peak near 8 meters. Below that, values gradually fell and retuned to very low levels. Increased fluorescence values near the bottom are likely caused by interference from bottom sediments.
July – Algae concentrations increase rapidly, and a distinct fluorescent peak is seen at 5 meters. This is likely where the colder, denser water provided algae a place to “sit”. Below this peak, values fall back down to low levels. The spike in values at the bottom was likely caused by sediment interference.
August – Fluorescence values were highest in the thermocline at 6 meters. In the deeper waters, fluorescence values were very low. The small spike at the bottom was again likely caused by sediment interference.
September – In the upper waters, fluorescence values gradually increased until reaching a peak at 7 meters. The fluorescence peak was accompanied by an oxygen decrease. This oxygen decrease could be produced by decomposing algae sitting where the colder, denser water provided the algae a place to “sit”. Below 7 meters, fluorescence values decreased and remained uniform throughout the deeper waters.
Synopsis: With the exception of a moderate-level fluorescent peak in July, algae concentrations were fairly low throughout the season. Growing conditions were most favorable for algae between 5 and 8 meters deep. High readings in the bottom waters were likely caused by sediment interference.

Gloeotrichia echinulata (a type of cyanobacteria (blue-green algae) commonly found in low-nutrient waters) can be seen with the naked eye. Gloeo density is reported as a value ranging from 0 – 6, based on the number of Gloeo colonies seen through a Secchi scope. Higher values indicate more Gloeo colonies. Peabody Pond’s Gloeotrichia echenulata density ranged from 0 through 1 with the highest density occurring in early August and early September.

