Sand Pond’s monthly fluorescence, oxygen, and temperature profiles. Chlorophyll concentration (green line), dissolved oxygen concentration (blue line), and temperature data (red line) were collected at every meter from the surface to the bottom from May through September.
Throughout the season, algae concentrations tended to be lower near the surface and higher near the thermocline. While fluorescence readings were highest in June and September, most months showed a fluorescent peak. These higher readings were fairly deep, between 4 and 10 meters, making them below the portion of the water column that people usually use. Elevated readings were occasionally below the thermocline. Those readings are not represented in the chlorophyll samples analyzed in the Water Quality figure above. June’s high reading near the bottom was likely caused by sediment interference
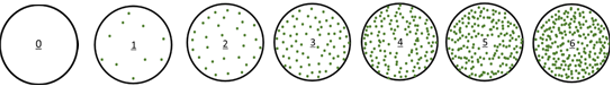
Gloeotrichia echinulata (a type of cyanobacteria (blue-green algae) commonly found in low-nutrient waters) can be seen with the naked eye. Gloeo density is reported as a value ranging from 0 – 6, based on the number of Gloeo colonies seen through a Secchi scope. Higher values indicate more Gloeo colonies. Gloeotrichia echenulata colonies were not observed in Sand Pond in 2024.