Donate and Join LEA Today!

Keoka Lake Algae And Fluorometer

Keoka Lake’s monthly fluorescence, oxygen, and temperature profiles. Chlorophyll concentration (green line), dissolved oxygen concentration (blue line), and temperature data (red line) were collected at every meter from the surface to the bottom from May through September.

May – LEA’s water testing team collected the first fluorometer profile in late May. At that time, Keoka Lake was stratified. In the upper waters, fluorescence values increased until reaching their peak at 6 meters. This fluorescence increase occurred near the thermocline where the rapidly changing water density provided algae a place to “sit”. In the middle and deep waters, fluorescence gradually decreased.
June – No clear fluorescence peak was noted this month. Fluorescence values oscillated between higher and lower from one meter to the next but generally remained uniform throughout the water column.
July – Warm surface waters provided algae favorable growing conditions, noted by the elevated fluorescence readings in the upper waters. Fluorescence values increased until reaching their peak at 2 meters. This is likely where the colder, denser water provided algae a place to “sit”. In the middle waters fluorescence values gradually decreased and remained uniform throughout the deep waters.
August – In the upper waters, fluorescence values gradually increased until reaching their peak at 3 meters. Fluorescence values were highest at 5 meters and then gradually decreased in the middle waters. Fluorescence was low and fairly uniform throughout the deeper waters. The fluorescent spike at the bottom was likely caused by interference from sediments.
September – In the upper waters, fluorescence values gradually increased until reaching their peak at 3 meters. In the middle waters, fluorescence values decreased. Fluorescence was low and fairly uniform throughout the deeper waters. The spike in values at the bottom was likely caused by sediment interference.
Synopsis: Algae concentrations were low to moderate throughout the water column and the season. The greatest concentrations were seen between 2 and 6 meters in depth and the highest (but still moderate) reading was seen near the surface in July. High readings in the bottom waters were likely caused by sediment interference.

Algae Observed on Keoka Lake

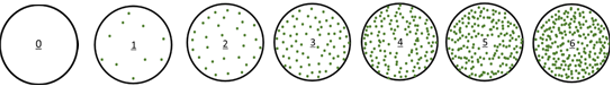
Gloeotrichia echinulata (a type of cyanobacteria (blue-green algae) commonly found in low-nutrient waters) can be seen with the naked eye. Gloeo density is reported as a value ranging from 0 – 6, based on the number of Gloeo colonies seen through a Secchi scope. Higher values indicate more Gloeo colonies. Keoka Lake’s Gloeotrichia echenulata density ranged from 0 through 1 with the highest density occurring throughout July and early August.

Common Algae Observed in LEA Service Area

[mc4wp_form id="2536"]