


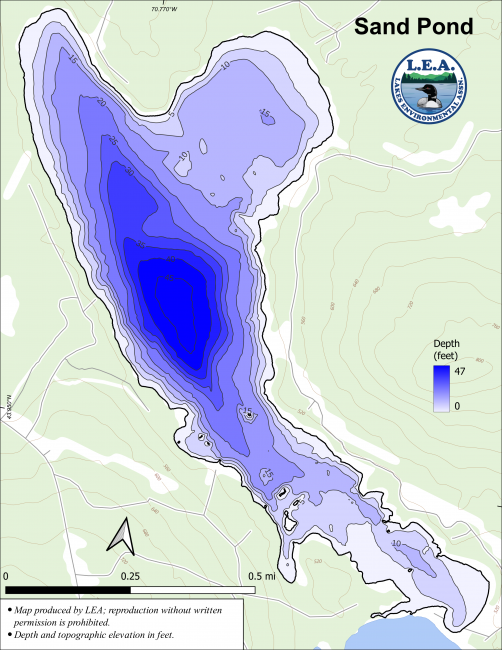
Sand Pond is connected to Hancock Pond with a narrow channel at the southern end.
Sand Pond was originally called Little Hancock Pond by Denmark’s early settlers. On several maps, it is also referred to as Walden Pond, named after the girls’ camp established on the pond in the summer of 1917.
Click on a program below for the most recent data summary. For descriptions of each program, return to our Lake Look-Up page.
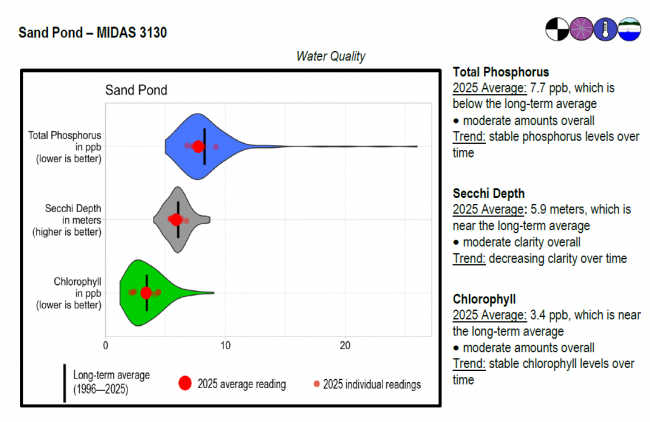
Sand Pond surface water chlorophyll (ppb), phosphorus (ppb), and Secchi depth (meters) data comparison. Colored areas represent the long-term range of values, from minimum to maximum. Area thickness indicates frequency of measurements at that value. Area thickness increases as more measurements are reported at that value. The vertical black line represents the long-term average value. The large red dot represents 2025’s average value. The small red dots represent individual readings taken in 2025.
Water Quality overview and methods
2025 as a Year (summary for all lakes)
2025-2026 data will be available in May
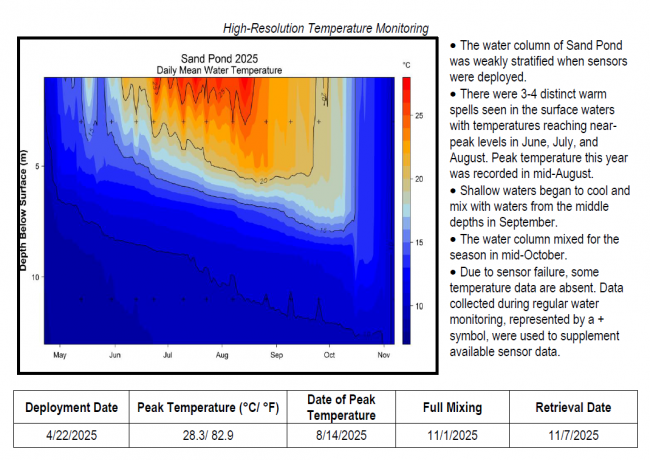
Temperature maps were generated using daily mean temperature values, which help determine temperature across depth and time. Temperature is represented by colored contours, where the red to blue color range corresponds to a high to low temperature range. The vertical bar on the right side of the temperature map indicates the temperature each color represents in degrees Fahrenheit (°F). The horizontal axis shows the months sensors were deployed, while the left-hand vertical axis shows sensor depth (meters) below the water’s surface.
Temperature stratification shows up as areas of the plot where colors change in the vertical direction and contour lines are tilted more towards horizontal (from June through early November). The area where temperature changes most rapidly with depth is often referred to as the thermocline. Vertical contour lines indicate mixed conditions, and areas of a single color from top to bottom (such as late-October into November) indicate completely mixed conditions. Warm, stratified conditions stand out as darker red areas. Large gaps between lines means there is a large temperature difference between depths.
High Resolution Temperature Monitoring Methods and Reading Graphs
 Algae Monitoring Summary
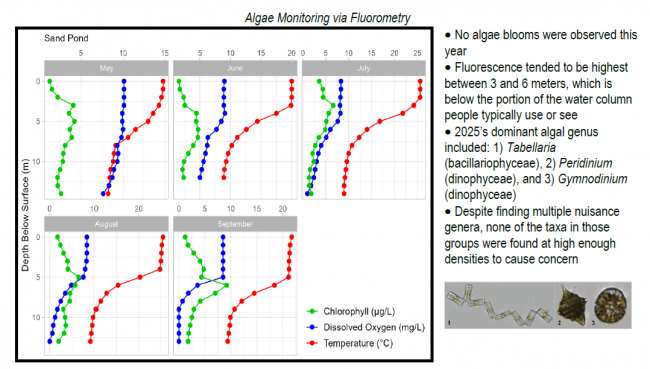
Graphs have been included for each test site to visually compare fluorometer, temperature, and oxygen profiles from May through September. The vertical axis (y-axis) indicates depth below the surface, while the horizontal axis (x-axis) represents reported values. Three different parameters are being reported on the same graph, which results in the value units for the horizontal axis varying, based on parameter. Units are noted in parentheses in the legend.
LEA also has active Courtesy Boat Inspection and LakeSmart programs on Sand Pond and offers technical assistance to landowners through Clean Lake Check Ups.
The pond has many coves, points, and islands that provide excellent habitat for a variety of warmwater fish species, including smallmouth and largemouth bass. Yellow perch, chain pickerel and hornpout are also found within its waters. Sand Pond lacks suitable salmonid spawning habitat. Oxygen depletion in the deeper waters of the pond limits the habitat for both trout species in the summer months. The large number of competing warmwater fish species further limits the potential for coldwater fisheries management. Smelt, juvenile yellow perch, and landlocked alewives provide an exceptional forage base for the bass. Other species present are: minnows, golden shiner, common shiner, fallfish white sucker, hornpout (bullhead), banded killifish, pumpkinseed sunfish, redbreast sunfish and American eel.
General fishing laws apply, except: From October 1 – December 31: ALO (Artificial lures only), S-7 (All trout, landlocked salmon, and togue caught must be released alive at once).
After a successful survey of the watershed to identify erosion sites and raise public awareness about water quality problems, LEA partnered with the Hancock and Sand Pond Association and Cumberland County Soil and Water Conservation District to correct some of the highest priority sites that were found. Through this grant, large conservation practices were installed on the West Shore Road, Wabanaki Road and Sand Pond Way. A significant portion of the grant was also used to address problems associated with residential properties.
Return to LEA’s Lake Look-Up page to search for a different lake, or type it in below.
