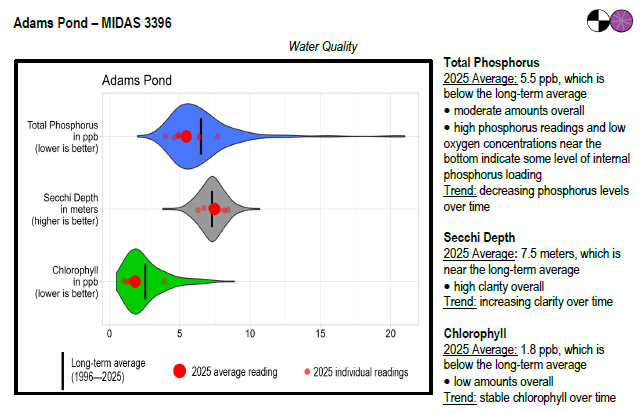
Adams Pond surface water chlorophyll (ppb), phosphorus (ppb), and Secchi depth (meters) data comparison. Colored areas represent the long-term range of values, from minimum to maximum. Area thickness indicates frequency of measurements at that value. Area thickness increases as more measurements are reported at that value. The vertical black line represents the long-term average value. The large red dot represents 2025’s average value. The small red dots represent individual readings taken in 2025.