


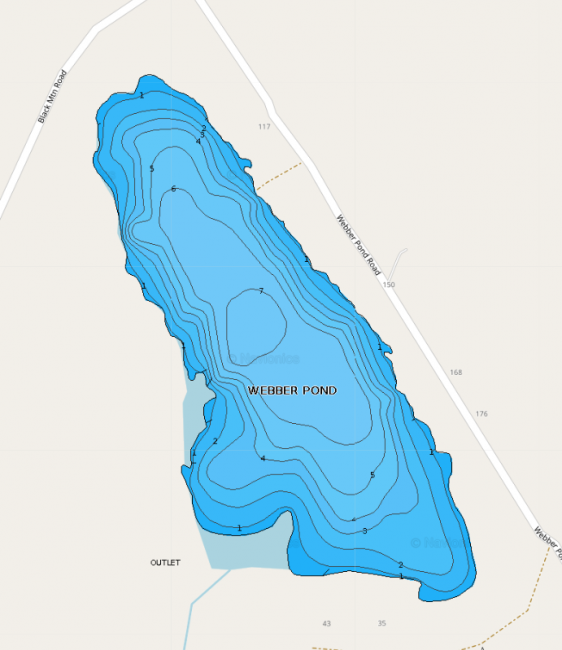
LEA visits Webber Pond to conduct water monitoring once a year in late August.
Click below for the most recent data summary.
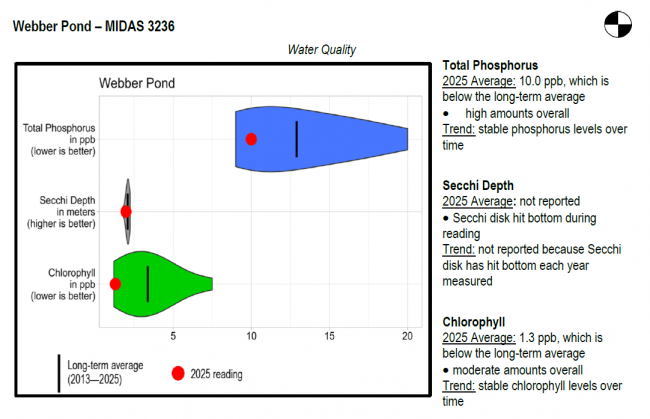
Webber Pond surface water chlorophyll (ppb), phosphorus (ppb), and Secchi depth (meters) data comparison. Colored areas represent the long-term range of values, from minimum to maximum. Area thickness indicates frequency of measurements at that value. Area thickness increases as more measurements are reported at that value. The vertical black line represents the long-term average value. The large red dot represents 2025’s average value. The small red dots represent individual readings taken in 2025.
Water Quality overview and methods
2025 as a Year (summary for all lakes)
LEA also offers technical assistance to landowners through LakeSmart evaluations and Clean Lake Check Ups.
Return to LEA’s Lake Look-Up page to search for a different lake, or type it in below.
