


Known invasive species: variable-leaf milfoil
Long Lake has a few public boat launches, allowing access to locals and visitors.
Long Lake is the second-largest water body in southern Maine and is part of the Presumpscot River drainage. It connects to Brandy Pond and Sebago Lake, making it popular with water-skiers and boaters.
Activities on the Causeway in Naples include trips on the Songo River Queen paddleboat, seaplane rides, windsurfing and para-sailing.
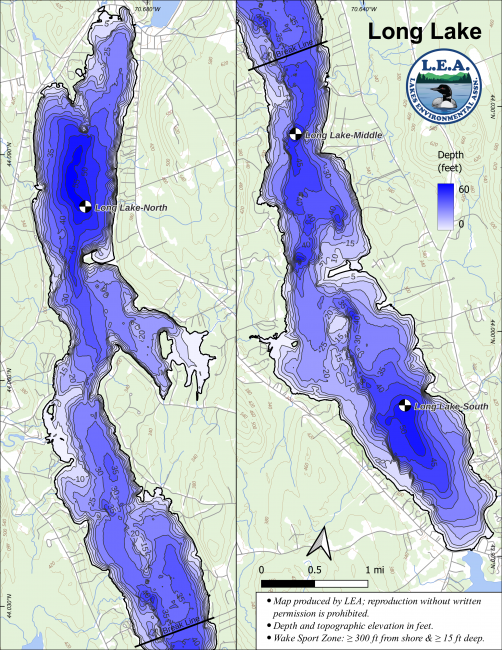
Due to Long Lake’s large area, LEA monitors and reports on the North, Main, and South basins individually. View the reports below for programs on each basin. For descriptions of each program, return to our Lake Look-Up page.
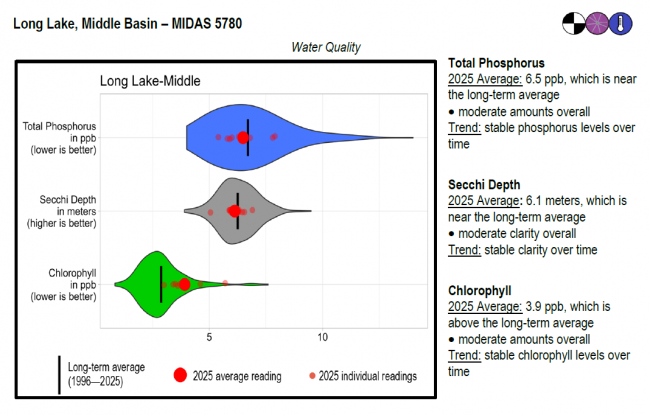
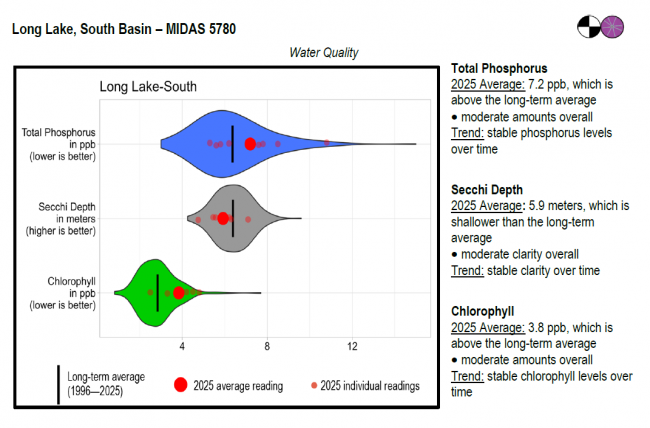
Long lake surface water chlorophyll (ppb), phosphorus (ppb), and Secchi depth (meters) data comparison. Colored areas represent the long-term range of values, from minimum to maximum. Area thickness indicates frequency of measurements at that value. Area thickness increases as more measurements are reported at that value. The vertical black line represents the long-term average value. The large red dot represents 2025’s average value. The small red dots represent individual readings taken in 2025.
Water Quality overview and methods
2025 as a Year (summary for all lakes)
Return to the top of this page the page.
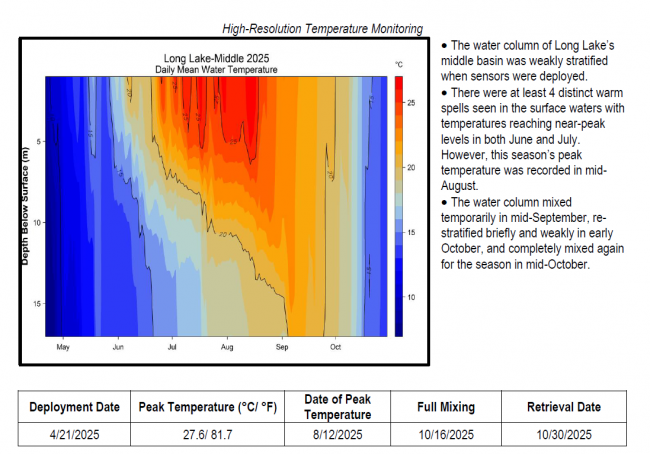
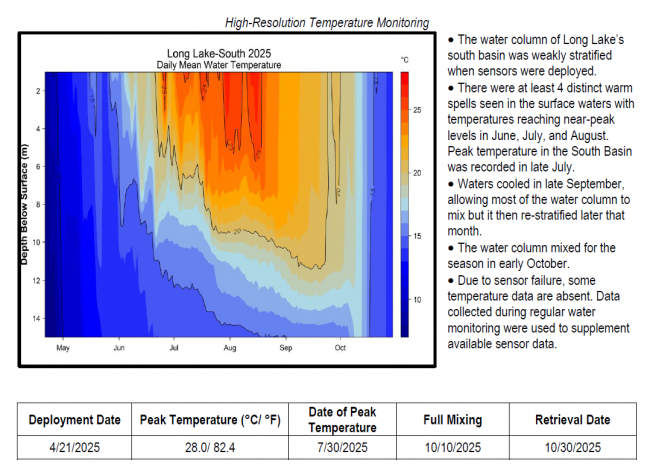
Temperature maps were generated using daily mean temperature values, which help determine temperature across depth and time. Temperature is represented by colored contours, where the red to blue color range corresponds to a high to low temperature range. The vertical bar on the right side of the temperature map indicates the temperature each color represents in degrees Fahrenheit (°F). The horizontal axis shows the months sensors were deployed, while the left-hand vertical axis shows sensor depth (meters) below the water’s surface.
Temperature stratification shows up as areas of the plot where colors change in the vertical direction and contour lines are tilted more towards horizontal (from June through early November). The area where temperature changes most rapidly with depth is often referred to as the thermocline. Vertical contour lines indicate mixed conditions, and areas of a single color from top to bottom (such as late-October into November) indicate completely mixed conditions. Warm, stratified conditions stand out as darker red areas. Large gaps between lines means there is a large temperature difference between depths.
High Resolution Temperature Monitoring Methods and Reading Graphs
Return to the top of this page the page.
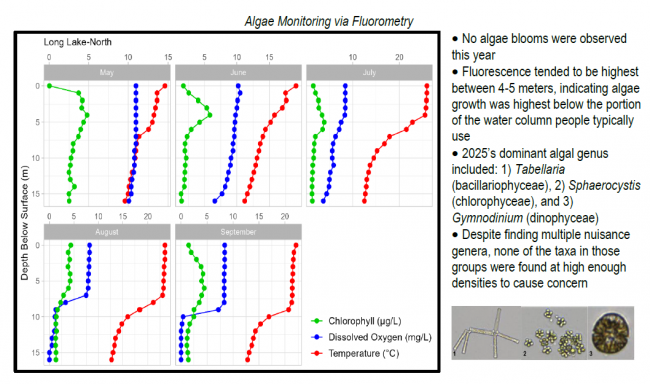
 Algae Monitoring Summary
Graphs have been included for each test site to visually compare fluorometer, temperature, and oxygen profiles from May through September. The vertical axis (y-axis) indicates depth below the surface, while the horizontal axis (x-axis) represents reported values. Three different parameters are being reported on the same graph, which results in the value units for the horizontal axis varying, based on parameter. Units are noted in parentheses in the legend.

Algae Methods and Reading Graphs
Algae Identification Via Flow Imaging Microscopy
Return to the top of this page the page.
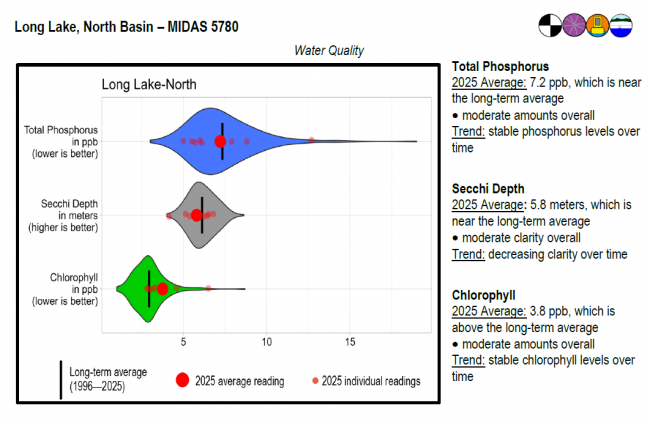
Long Lake surface water chlorophyll (ppb), phosphorus (ppb), and Secchi depth (meters) data comparison. Colored areas represent the long-term range of values, from minimum to maximum. Area thickness indicates frequency of measurements at that value. Area thickness increases as more measurements are reported at that value. The vertical black line represents the long-term average value. The large red dot represents 2025’s average value. The small red dots represent individual readings taken in 2025.
Water Quality overview and methods
2025 as a Year (summary for all lakes)
Return to the top of this page the page.
2025-2026 data will be available in May
Return to the top of this page the page.
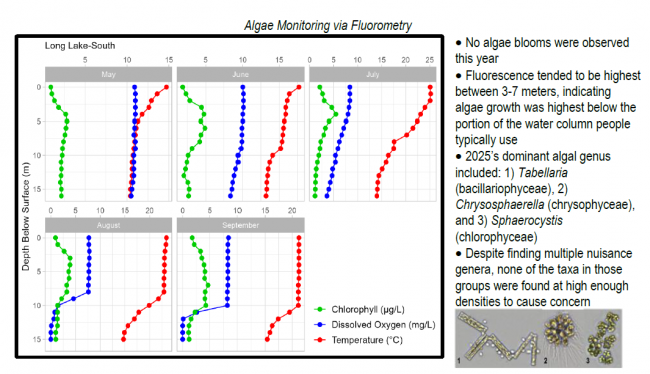
Algae Monitoring SummaryGraphs have been included for each test site to visually compare fluorometer, temperature, and oxygen profiles from May through September. The vertical axis (y-axis) indicates depth below the surface, while the horizontal axis (x-axis) represents reported values. Three different parameters are being reported on the same graph, which results in the value units for the horizontal axis varying, based on parameter. Units are noted in parentheses in the legend.
Algae Methods and Reading Graphs
Algae Identification Via Flow Imaging Microscopy
Return to the top of this page the page.
Long Lake surface water chlorophyll (ppb), phosphorus (ppb), and Secchi depth (meters) data comparison. Colored areas represent the long-term range of values, from minimum to maximum. Area thickness indicates frequency of measurements at that value. Area thickness increases as more measurements are reported at that value. The vertical black line represents the long-term average value. The large red dot represents 2025’s average value. The small red dots represent individual readings taken in 2025.
Water Quality overview and methods
2025 as a Year (summary for all lakes)
Return to the top of this page the page.
Temperature maps were generated using daily mean temperature values, which help determine temperature across depth and time. Temperature is represented by colored contours, where the red to blue color range corresponds to a high to low temperature range. The vertical bar on the right side of the temperature map indicates the temperature each color represents in degrees Fahrenheit (°F). The horizontal axis shows the months sensors were deployed, while the left-hand vertical axis shows sensor depth (meters) below the water’s surface.
Temperature stratification shows up as areas of the plot where colors change in the vertical direction and contour lines are tilted more towards horizontal (from June through early November). The area where temperature changes most rapidly with depth is often referred to as the thermocline. Vertical contour lines indicate mixed conditions, and areas of a single color from top to bottom (such as late-October into November) indicate completely mixed conditions. Warm, stratified conditions stand out as darker red areas. Large gaps between lines means there is a large temperature difference between depths.
High Resolution Temperature Monitoring Methods and Reading Graphs
Return to the top of this page the page.
Algae Monitoring SummaryGraphs have been included for each test site to visually compare fluorometer, temperature, and oxygen profiles from May through September. The vertical axis (y-axis) indicates depth below the surface, while the horizontal axis (x-axis) represents reported values. Three different parameters are being reported on the same graph, which results in the value units for the horizontal axis varying, based on parameter. Units are noted in parentheses in the legend.
Algae Methods and Reading Graphs
Algae Identification Via Flow Imaging Microscopy
Return to the top of this page the page.
Live Buoy Data from Long Lake (North Basin)
LEA also has active Courtesy Boat Inspection and LakeSmart programs on Long Lake and offers technical assistance to landowners through Clean Lake Check Ups.
Long Lake supports a high quality black bass fishery and is one of the more popular lakes in southern Maine for bass angling tournaments. Other principal fisheries are landlocked Atlantic salmon, brown trout, chain pickerel, and white perch. Twelve other species also are present, including American eel, golden and common shiner, fallfish, white sucker, brown bullhead, burbot, lake and brook trout, pumpkinseed sunfish, yellow perch, and rainbow smelt. Each fall the lake is stocked with landlocked salmon and brown trout from the state hatcheries.
General fishing laws apply, except: From October 1 – December 31: ALO (Artificial lures only), S-7 (All trout, landlocked salmon, and togue caught must be released alive at once).
This project aimed to significantly reduce erosion, sediment and phosphorus export into Long Lake. The grant began in the spring of 2006 and conservation practices that reduce erosion and polluted runoff were installed at over 27 sites throughout the watershed. Roads, beaches and residential properties were worked on during the project. A Youth Conservation Corp (YCC) was also formed which installed best management practices on numerous residential properties.
A TMDL is a detailed watershed report with land use information and phosphorus loading estimates for a specific lake. The acronym TMDL stands for “Total Maximum Daily Load” and for Maine lakes it is used as a tool to assess and reduce phosphorus loading from within the entire watershed. Working with the Maine Association of Conservation Districts and Maine Department of Environmental Protection, LEA helped compile, organize and write a TMDL for Long Lake. The non-regulatory reports are intended to serve as a platform for future implementation work and watershed planning. It can also be used to compliment comprehensive planning updates. In addition to the land use inventory and phosphorus loading estimates, the reports contain water quality, fishery and soils information, a shoreline survey and recommendations for future best management practices in the watershed. Fine the TMDL report for Long Lake here.
Return to LEA’s Lake Look-Up page to search for a different lake, or type it in below.
