


There are two public boat ramps. One is located off Route 302 between the North and Main basins. The other is located off Denmark Rd and provides access to the South basin of the pond.
Moose Pond passes by the foot of the Pleasant Mountain range. The causeway that now separates the north basin from the main basin was once a low wooden bridge on top of pine cribbing, which was built by cutting holes through the ice in the winter of 1834.
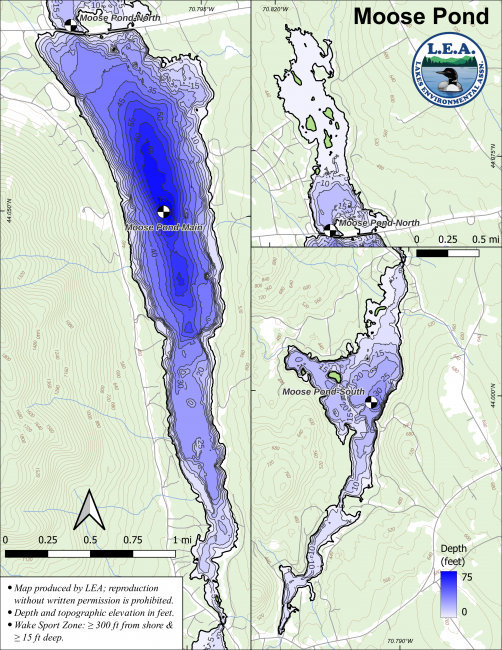
Due to Moose Pond’s large area, LEA monitors and reports on the North, Main, and South basins individually. View the reports below for each basin. For descriptions of each program, return to our Lake Look-Up page.
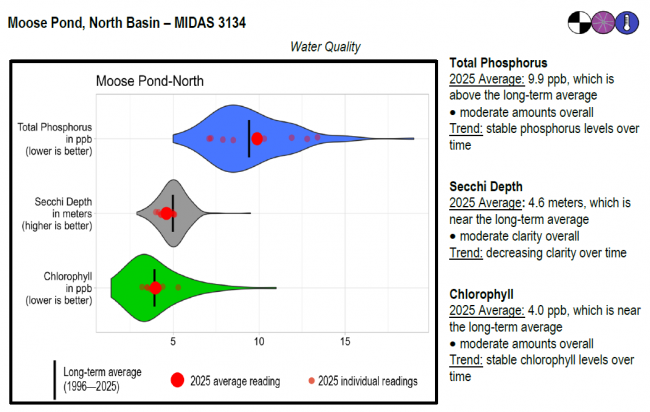
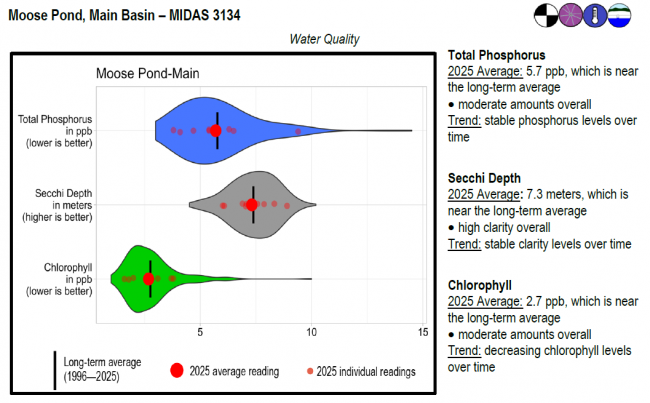
Moose Pond surface water chlorophyll (ppb), phosphorus (ppb), and Secchi depth (meters) data comparison. Colored areas represent the long-term range of values, from minimum to maximum. Area thickness indicates frequency of measurements at that value. Area thickness increases as more measurements are reported at that value. The vertical black line represents the long-term average value. The large red dot represents 2025’s average value. The small red dots represent individual readings taken in 2025.
Water Quality overview and methods
2025 as a Year (summary for all lakes)
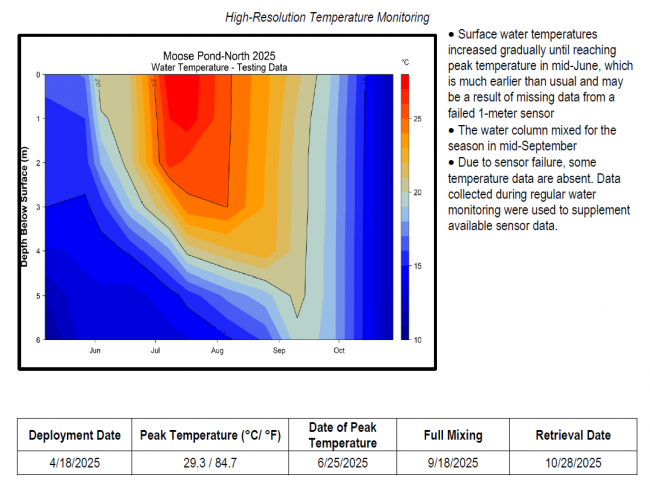
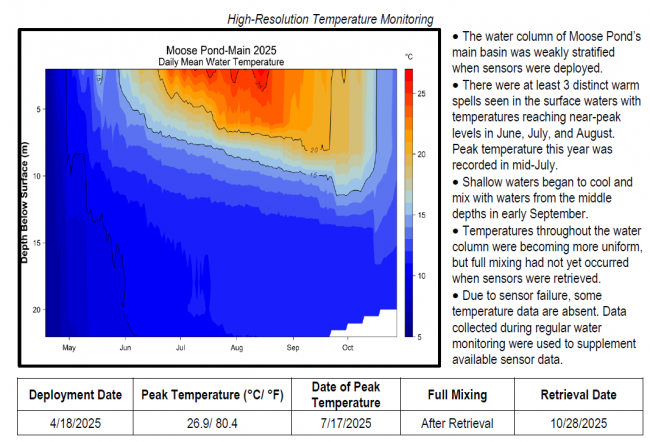
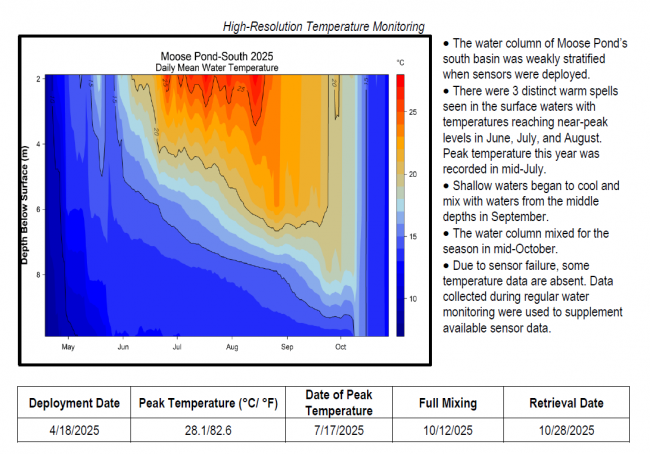
Temperature maps were generated using daily mean temperature values, which help determine temperature across depth and time. Temperature is represented by colored contours, where the red to blue color range corresponds to a high to low temperature range. The vertical bar on the right side of the temperature map indicates the temperature each color represents in degrees Fahrenheit (°F). The horizontal axis shows the months sensors were deployed, while the left-hand vertical axis shows sensor depth (meters) below the water’s surface.
Temperature stratification shows up as areas of the plot where colors change in the vertical direction and contour lines are tilted more towards horizontal (from June through early November). The area where temperature changes most rapidly with depth is often referred to as the thermocline. Vertical contour lines indicate mixed conditions, and areas of a single color from top to bottom (such as late-October into November) indicate completely mixed conditions. Warm, stratified conditions stand out as darker red areas. Large gaps between lines means there is a large temperature difference between depths.
High Resolution Temperature Monitoring Methods and Reading Graphs
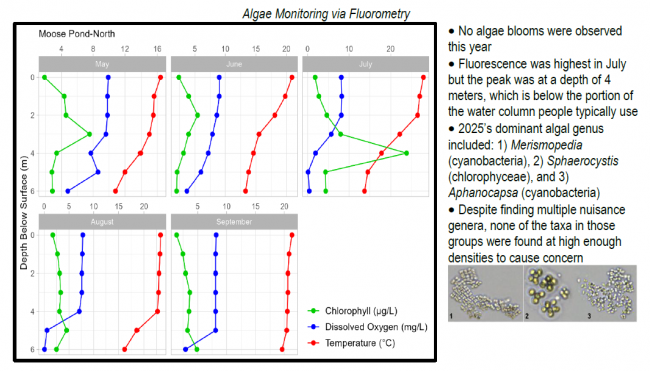
 Algae Monitoring Summary
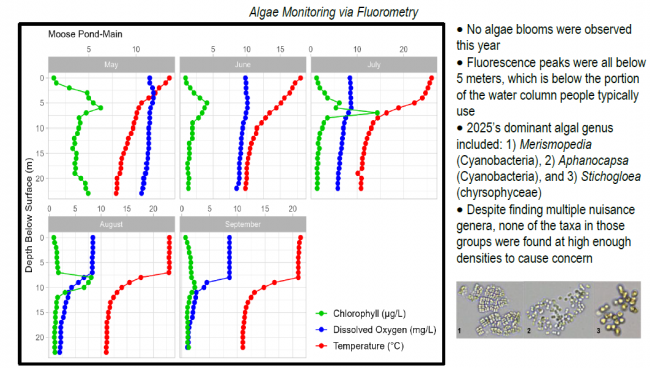
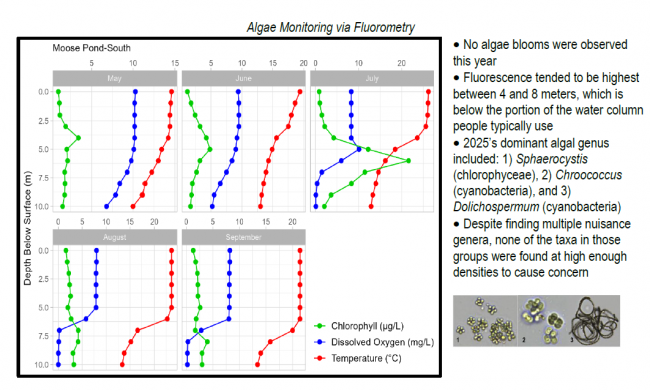
Graphs have been included for each test site to visually compare fluorometer, temperature, and oxygen profiles from May through September. The vertical axis (y-axis) indicates depth below the surface, while the horizontal axis (x-axis) represents reported values. Three different parameters are being reported on the same graph, which results in the value units for the horizontal axis varying, based on parameter. Units are noted in parentheses in the legend.
Moose Pond surface water chlorophyll (ppb), phosphorus (ppb), and Secchi depth (meters) data comparison. Colored areas represent the long-term range of values, from minimum to maximum. Area thickness indicates frequency of measurements at that value. Area thickness increases as more measurements are reported at that value. The vertical black line represents the long-term average value. The large red dot represents 2025’s average value. The small red dots represent individual readings taken in 2025.
Water Quality overview and methods
2025 as a Year (summary for all lakes)
Temperature maps were generated using daily mean temperature values, which help determine temperature across depth and time. Temperature is represented by colored contours, where the red to blue color range corresponds to a high to low temperature range. The vertical bar on the right side of the temperature map indicates the temperature each color represents in degrees Fahrenheit (°F). The horizontal axis shows the months sensors were deployed, while the left-hand vertical axis shows sensor depth (meters) below the water’s surface.
Temperature stratification shows up as areas of the plot where colors change in the vertical direction and contour lines are tilted more towards horizontal (from June through early November). The area where temperature changes most rapidly with depth is often referred to as the thermocline. Vertical contour lines indicate mixed conditions, and areas of a single color from top to bottom (such as late-October into November) indicate completely mixed conditions. Warm, stratified conditions stand out as darker red areas. Large gaps between lines means there is a large temperature difference between depths.
High Resolution Temperature Monitoring Methods and Reading Graphs
Algae Monitoring SummaryGraphs have been included for each test site to visually compare fluorometer, temperature, and oxygen profiles from May through September. The vertical axis (y-axis) indicates depth below the surface, while the horizontal axis (x-axis) represents reported values. Three different parameters are being reported on the same graph, which results in the value units for the horizontal axis varying, based on parameter. Units are noted in parentheses in the legend.
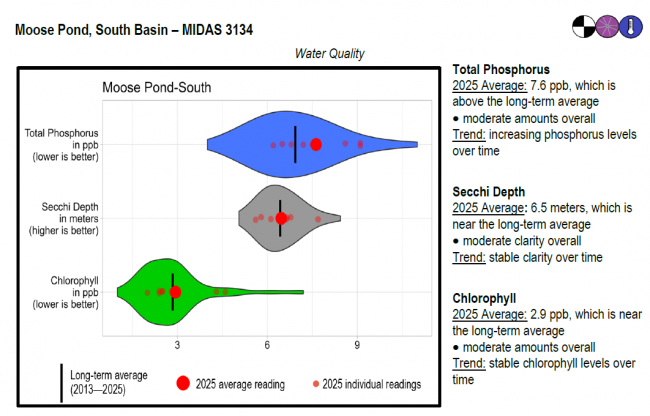
LEA also has active Courtesy Boat Inspection and LakeSmart programs on Moose Pond and offers technical assistance to landowners through Clean Lake Check Ups.
Moose Pond is divided into three distinct basins. The upper and lower basins both experience low dissolved oxygen concentrations in the deeper waters, which provides little habitat for coldwater fish species. Although oxygen depletion often limits summer habitat, the middle basin is managed primarily for landlocked salmon and lake trout. The pond also supports populations of largemouth bass, smallmouth bass, yellow perch, white perch, chain pickerel, hornpout, rainbow smelt, white sucker, fallfish, golden shiners, pumpkinseed sunfish and slimy sculpin.
General fishing laws apply, except: S-22 (Daily bag limit on landlocked salmon: 1 fish). Open to the taking of smelts, except the tributaries Miller Brook and Sucker Brook (Beaver Pond Outlet), and that area within 100 feet of the mouth of either brook: S-1 (Closed to the taking of smelts). From January 1 – March 31: Minimum length limit on landlocked salmon: 16 inches. From October 1 – December 31: ALO (Artificial lures only), S-7 (All trout, landlocked salmon, and togue caught must be released alive at once).
LEA worked with the Moose Pond Association and Cumberland County Soil and Water Conservation District to survey erosion sites in the pond’s 11,170-acre watershed in 2010. Volunteers and technical staff identified 178 erosion sites that negatively impact the pond. Most of the sites documented were small, but the cumulative impact of all these sites is substantial. The report includes a brief description, location details, and recommendations for correcting each problem. In addition to documenting erosion, the project helped citizens learn about water quality and how our activities affect ponds and lakes. To view a copy of the survey, click on: Moose Pond Watershed Survey. From 2012-2014, LEA worked on a much larger implementation project in the watershed to correct the major problems identified during the survey. For more information about this aspect of the project, call LEA (647-8580).
Return to LEA’s Lake Look-Up page to search for a different lake, or type it in below.
