


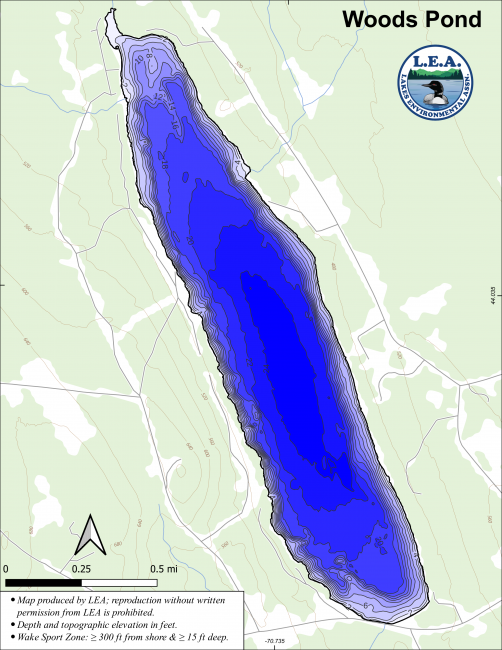
A public boat launch is located on the southern shore, off Route 117, next to the town beach.
Woods Pond is said to be named after Bridgton’s first surveyor, Solomon Wood, who came to the area in 1776.
In 2003, Woods Pond became the first waterbody in the area to have a milfoil wash station, which was designed, installed, and paid for by the Woods Pond Association, LEA, and the town of Bridgton.
Click on a program below for the most recent data summary. For descriptions of each program, return to our Lake Look-Up page.
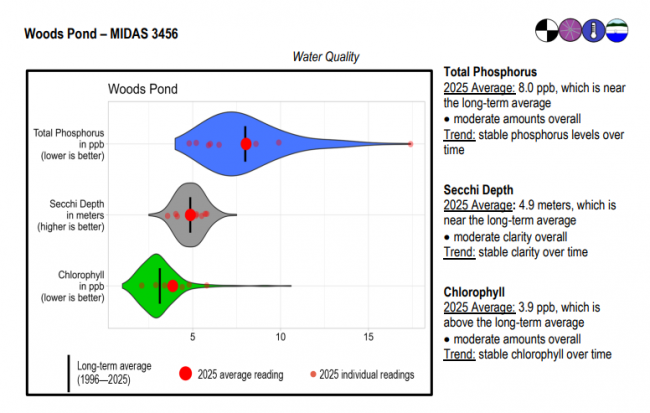
Woods Pond surface water chlorophyll (ppb), phosphorus (ppb), and Secchi depth (meters) data comparison. Colored areas represent the long-term range of values, from minimum to maximum. Area thickness indicates frequency of measurements at that value. Area thickness increases as more measurements are reported at that value. The vertical black line represents the long-term average value. The large red dot represents 2025’s average value. The small red dots represent individual readings taken in 2025.
Water Quality overview and methods
2025 as a Year (summary for all lakes)
2025-2026 data will be available in May
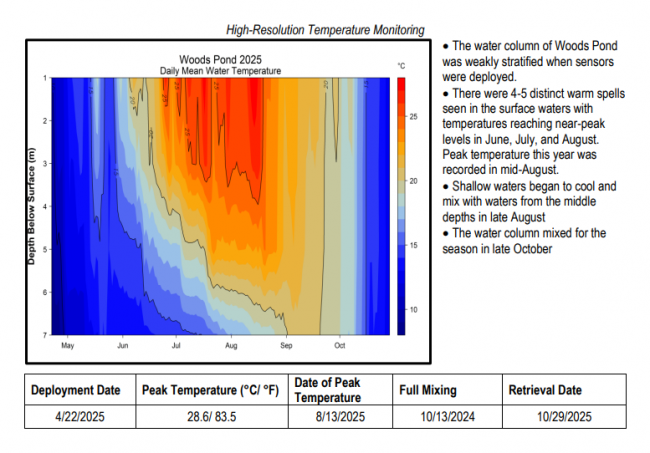
Temperature maps were generated using daily mean temperature values, which help determine temperature across depth and time. Temperature is represented by colored contours, where the red to blue color range corresponds to a high to low temperature range. The vertical bar on the right side of the temperature map indicates the temperature each color represents in degrees Fahrenheit (°F). The horizontal axis shows the months sensors were deployed, while the left-hand vertical axis shows sensor depth (meters) below the water’s surface.
Temperature stratification shows up as areas of the plot where colors change in the vertical direction and contour lines are tilted more towards horizontal (from June through early November). The area where temperature changes most rapidly with depth is often referred to as the thermocline. Vertical contour lines indicate mixed conditions, and areas of a single color from top to bottom (such as late-October into November) indicate completely mixed conditions. Warm, stratified conditions stand out as darker red areas. Large gaps between lines means there is a large temperature difference between depths.
High Resolution Temperature Monitoring Methods and Reading Graphs
 Algae Monitoring Summary
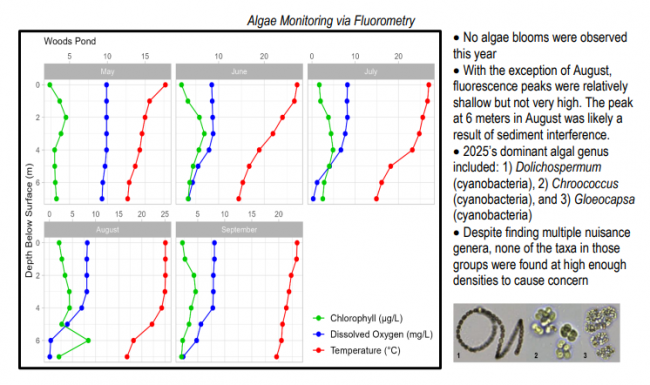
Graphs have been included for each test site to visually compare fluorometer, temperature, and oxygen profiles from May through September. The vertical axis (y-axis) indicates depth below the surface, while the horizontal axis (x-axis) represents reported values. Three different parameters are being reported on the same graph, which results in the value units for the horizontal axis varying, based on parameter. Units are noted in parentheses in the legend.
Algae Methods and Reading Graphs
LEA also has active Courtesy Boat Inspection and LakeSmart programs on Woods Pond and offers technical assistance to landowners through Clean Lake Check Ups.
Woods Pond’s relatively shallow depth and warm waters make it ideal for warmwater fish. Smallmouth bass, largemouth bass, white perch and chain pickerel all do well in the pond. It is also regularly stocked with brown trout from state hatcheries. Although brown trout is more tolerant of warmer waters than most of its relatives, populations are maintained only through stocking. Landlocked salmon is poorly suited for the pond, but small stockings are occasionally done by the state. Woods is also home to rainbow smelt, yellow perch, white sucker, hornpout, pumpkinseed sunfish, American eel, and fallfish and common shiner. General fishing laws apply, except: From October 1 – December 31: ALO (Artificial lures only), S-7 (All trout, landlocked salmon, and togue caught must be released alive at once).
A survey of the Woods Pond watershed revealed 79 active erosion problems affecting water quality in the pond. Looking at a map showing all the sites, it is easy to pick up on a common thread; the majority of these problem areas are found along roads. Over 70% of the sites identified were associated with public or private roads.
View the Woods Pond Survey Report, Survey Maps, and Erosion Site Database
After completing the survey, the Woods Pond Watershed-Based Plan was developed to help guide further conservation work on the pond.
LEA worked with many local and regional partners to implement erosion control work throughout the Woods Pond Watershed from 2014 to 2016. Projects were completed with funding from the US EPA Clean Water Act, and match funding from landowners and private partners accounted for more than 60% of the total cost. Through this grant, large-scale conservation practices were installed at 17 sites around the pond and at a dozen smaller, residential sites. Several educational workshops were also held throughout the project. For more information about this work, check out the Woods Pond Project Brochure.
Average monthly water levels 2010-September 2025
Above water level information compiled and submitted by Barry DeNofrio
Water level report photo compilation
map key, map 1, map 2, map 3, map 4, map 5,
Water level report and maps submitted by the Woods Pond Water Quality Committee
Return to LEA’s Lake Look-Up page to search for a different lake, or type it in below.
